The Crowding Effect: Importance in reading readiness and its assessment
What is the crowding effect?
People with amblyopia experience the crowding effect, which is described as difficulty reading a letter when it is surrounded by other letters or contours. For this reason, when testing visual acuity in amblyopes, you may measure a better visual acuity using isolated letters than if you use a single line or the entire chart. When reading a row of letters, amblyopes can usually also read the first and last letters more easily than the middle letters. The crowding effect is more pronounced in strabismic amblyopes than anisometropic amblyopes.
Importance of measuring the crowding effect in assessing reading readiness
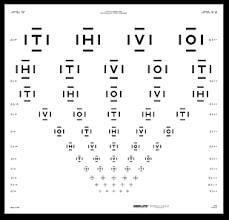
Visual acuity values in preschool-aged children (+-4 year olds) are measurable at near and far distances with the standard line tests (100% spacing). On the more crowded tests of near vision, the spacing is 50%, 25%, and 12%. These tests are important in detection of increased crowding effect, which should be known when assessing vision for reading and other visually demanding tasks. The knowledge of whether or not crowding is present in a child’s vision, and to what extent, is important in figuring out if he is ready to read. If not, he can be helped though specific vision therapy.
How to measure the crowding effect?
Visual acuity and the effect of crowding can be measured indirectly using a whole chart, a single line or a single letter. The LogMAR or ETDRS charts are important for measuring amblyopic acuity as they take the crowding effect into consideration and are far more accurate for acuity reading than the Snellen chart. At some point the LogMAR / ETDRS charts appeared to be poised to displace Snellen Charts, which would to some degree address crowding by keeping inter-letter spacing constant. Unfortunately, the change has not been widely adopted yet, and Hermann Snellen’s 1862 chart still rules the day in most clinical practices.
A quick overview of the advantages of the LogMAR / ETDRS chart (with Sloan font) vs the Snellen chart.
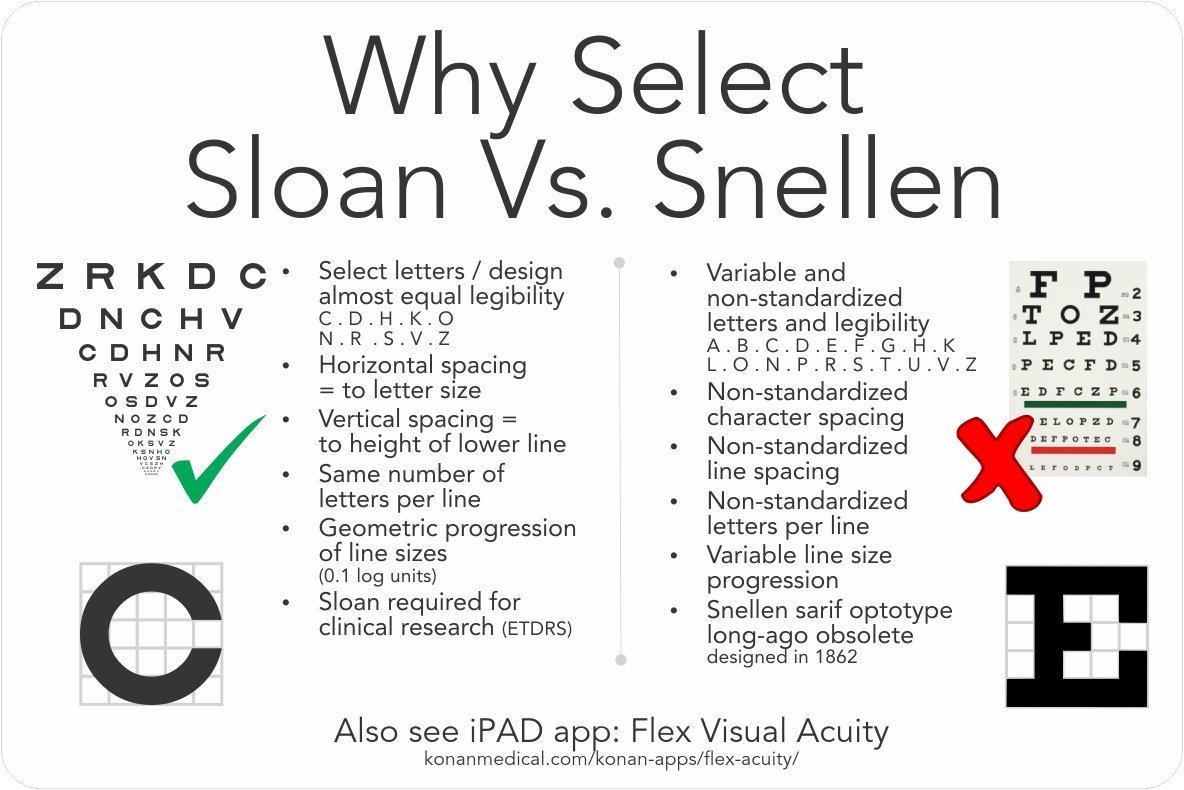
From Wikipedia: “The LogMAR chart is designed to enable more accurate estimates of acuity as compared to other acuity charts (e.g., the Snellen chart). Each line of the LogMAR chart comprises the same number of test letters (effectively standardizing the test across letter size); the Sloan font is used (Sloan letters are approximately equally legible one from another); letter size from line to line varies logarithmically, as does the spacing between lines (making the chart easy to use at nonstandard viewing distances). Furthermore, the final LogMAR score is based on the total of all letters read.”
The crowding effect can also be measured directly by charts with “crowding bars” around the individual letters, such as this chart from Good Lite.

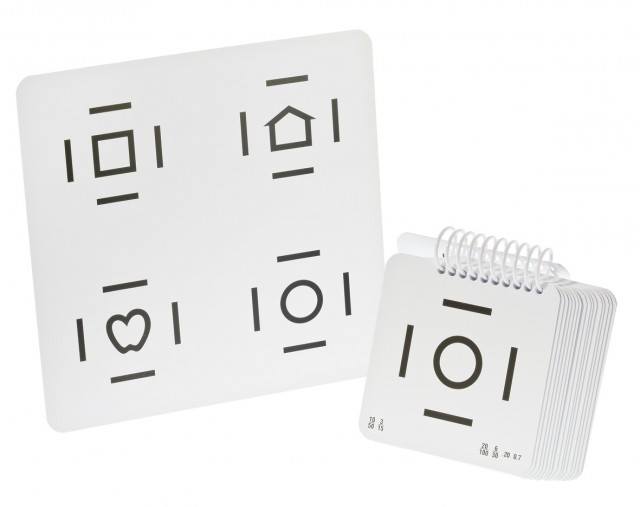
For younger children, who don’t know how to read yet, there are LEA charts with pictograms to measure the crowding effect.
Related article:
– What other visual anomalies do amblyopes have aside from reduced visual acuity and poor stereopsis?